Forecasts
See how a software estimator approaches estimation of deaths during a pandemic.
Information Center—Full Archives
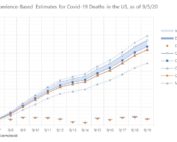
My CDC Ensemble Model Covid-19 Forecasts – 9/5/20 Update
New National Baseline Forecasts My national death forecasts for the next 4 weeks are 9/6-12 5261 9/13-19 5178 (2-week total of 10,439) 9/20-26 5220 (3-week total of 15,659) 9/27-10/3 5220 (4-week total of 20,879) Read more
State Open-Readiness Assessments for 8/27/20
These assessments show state-level data that can help assess each state's readiness to reopen.
Covid-19 Estimate Update 8/23/20 – Estimates Included in CDC Forecast
New 14-Day National Baseline Estimate My estimates (aka forecasts) are now being included in the CDC's Ensemble model. Mine are the "CovidComplete" forecasts. CDC forecasts use 7-day periods from Sunday through Saturday. My new Read more
State Open-Readiness Assessments for 8/17/20
These assessments show state-level data that can help assess each state's readiness to reopen.
State Open-Readiness Assessments for 7/31/20
These assessments show state-level data that can help assess each state's readiness to reopen.
Provincial Pandemic Assessments for 7/31/20
These assessments show state-level data that can help assess the state of the pandemic in each province.
State Positive Test Percentages (Positivity) 7/23/20
Test Positivity The percentage of virus tests that show positive results ("positivity") is an indicator of the percentage of the total infections that is being identified through testing. The higher the positivity is, the Read more
State Open-Readiness Assessments for 7/21/20
These assessments show state-level data that can help assess each state's readiness to reopen.
State Positive Test Percentages (Positivity) 7/9/20
There's a New York Times article today that makes some comments about percentage of positive tests in each state. It's quite critical, and I think it whitewashes the challenge of building the surge capacity Read more
State Open-Readiness Assessments for 7/9/20
These assessments show state-level data that can help assess each state's readiness to reopen.
State Open-Readiness Assessments for 7/5/20
These assessments show state-level data that can help assess each state's readiness to reopen.
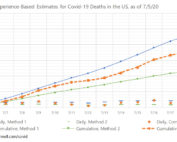
Covid-19 Estimate Update 7/6/20
Recent Covid-19 Fatality Forecasts are Far Too Dire With the sharp increase in positive tests being reported recently, we are starting to see some really extreme predictions about the Read more
Provincial History of Infections 7/2/20
These graphs show the history of Covid-19 infections in each province. The total number of infections is calculated using the two infection models. Most provinces have had few enough positive tests and deaths that Read more
Provincial Log Graphs – 7/2/20
These graphs show data related to the covid-19 pandemic in Canada.
Provincial Testing Trends 7/2/20
These graphs show the 7-day trends in positive test results for each province. The data has been retrieved from the Government of Canada. The graphs compare the number of positive tests for the most Read more
Provincial Data – Raw and Smoothed – 7/2/20
These graphs show data related to the covid-19 pandemic in Canada.
Provincial Positive Test Percentages (Positivity) 7/2/20
The percentage of virus tests that show positive results ("positivity") is an indicator of the percentage of the total infections that is being identified through testing. The higher the positivity is, the lower the Read more
Provincial History of Contagiousness 7/2/20
These graphs show the history of contagiousness in each province.Contagiousness is calculated as the number of people who are actively infected for the 9-day period from 3 days before a positive test to 5 days Read more
State Open-Readiness Assessments for 7/2/20
These assessments show state-level data that can help assess each state's readiness to reopen.
State Testing Trends – 7/2/20
These graphs show data related to the covid-19 pandemic in the US.
State Data – Raw and Smoothed – 7/2/20
These graphs show data related to the covid-19 pandemic in the US.
State Contagiousness – 7/2/20
These graphs show data related to the covid-19 pandemic in the US.
State Positive Test Percentages (Positivity) 7/2/20
The percentage of virus tests that show positive results ("positivity") is an indicator of the percentage of the total infections that is being identified through testing. The higher the positivity is, the lower the Read more
State Log Graph Updates 7/2/20
These log graphs provide a different perspective on the rate of Covid-19 positive tests and deaths. On most graphs, the x-axis is time. On these graphs, the x-axis is the total number of cases Read more
State History of Infections – 7/2/20
These graphs show data related to the covid-19 pandemic in the US.
US Data Updates 7/2/20
We have quite a few interesting things going on in recent data.Positive Tests Up More, Deaths Still FlatThe interesting issue continues to be the significant increase in positive tests with deaths being more or less Read more
State History of Infections – 6/26/20
These graphs show data related to the covid-19 pandemic in the US.
Tech Talk: Weekly Update 6/26/20
Tech Talk: Covid-19 Data and Estimates—Week in Review. I give a weekly update on Covid-19 data, trends, and estimates. These are slides from that presentation. The presentations are normally on Friday mornings and are Read more
US Data Updates 6/24/20
We have quite a few interesting things going on in recent data. Positive Tests Up, Deaths Flat The interesting issue continues to be the significant increase in positive tests with deaths being more or Read more
Provincial Pandemic Assessments for 6/23/20
These assessments show state-level data that can help assess the state of the pandemic in each province.
State Open-Readiness Assessments for 6/23/20
These assessments show state-level data that can help assess each state's readiness to reopen.
Provincial Log Graphs – 6/23/20
These graphs show data related to the covid-19 pandemic in Canada.
State Log Graph Updates 6/23/20
These log graphs provide a different perspective on the rate of Covid-19 positive tests and deaths. On most graphs, the x-axis is time. On these graphs, the x-axis is the total number of cases Read more
Provincial Positive Test Percentages (Positivity) 6/23/20
The percentage of virus tests that show positive results ("positivity") is an indicator of the percentage of the total infections that is being identified through testing. The higher the positivity is, the lower the Read more
State Positive Test Percentages (Positivity) 6/23/20
The percentage of virus tests that show positive results ("positivity") is an indicator of the percentage of the total infections that is being identified through testing. The higher the positivity is, the lower the Read more
Provincial History of Contagiousness 6/23/20
These graphs show the history of contagiousness in each province. Contagiousness is calculated as the number of people who are actively infected for the 8-period from 3 days before a positive test to 4 Read more
State Contagiousness – 6/23/20
These graphs show data related to the covid-19 pandemic in the US.
Provincial Testing Trends 6/23/20
These graphs show the 7-day trends in positive test results for each province. The data has been retrieved from the Government of Canada. The graphs compare the number of positive tests for the most Read more
State Testing Trends – 6/23/20
These graphs show data related to the covid-19 pandemic in the US.
Provincial Data – Raw and Smoothed – 6/23/20
These graphs show data related to the covid-19 pandemic in Canada.
State Data – Raw and Smoothed – 6/23/20
These graphs show data related to the covid-19 pandemic in the US.
Provincial Positive Test Percentages (Positivity) 6/18/20
The percentage of virus tests that show positive results ("positivity") is an indicator of the percentage of the total infections that is being identified through testing. The higher the positivity is, the lower the Read more
Provincial Data – Raw and Smoothed – 6/18/20
These graphs show data related to the covid-19 pandemic in Canada.
Provincial Pandemic Assessments for 6/18/20
These assessments show state-level data that can help assess the state of the pandemic in each province.
Provincial Log Graphs – 6/18/20
These graphs show data related to the covid-19 pandemic in Canada.
Provincial Testing Trends 6/18/20
These graphs show the 7-day trends in positive test results for each province. The data has been retrieved from the Government of Canada. The graphs compare the number of positive tests for the most Read more
Provincial History of Contagiousness 6/18/20
These graphs show the history of contagiousness in each province. Contagiousness is calculated as the number of people who are actively infected for the 8-period from 3 days before a positive test to 4 Read more
History of Positive Tests by State (Animation) – 6/16/20
This video shows the history of positive test results in each state. Each state's point on the graph represents the number of positive tests per 1000 residents for the 7 day period indicated at Read more
US Data Updates 6/16/20
These graphs show data related to the covid-19 pandemic in the US. We're starting to see more positive tests, and the trend for the past few days continues to be up. Deaths are still Read more
State Open-Readiness Assessments for 6/16/20
These assessments show state-level data that can help assess each state's readiness to reopen.
State Open-Readiness Assessments for 6/14/20
These assessments show state-level data that can help assess each state's readiness to reopen.
US Data Updates 6/14/20
These graphs show data related to the covid-19 pandemic in the US. We're starting to see more positive tests, and the trend for the past few days has definitely been up. My estimation model Read more
State Positive Test Percentages (Positivity) 6/13/20
The percentage of virus tests that show positive results ("positivity") is an indicator of the percentage of the total infections that is being identified through testing. The higher the positivity is, the lower the Read more
State Log Graph Updates 6/12/20
These log graphs provide a different perspective on the rate of Covid-19 positive tests and deaths. On most graphs, the x-axis is time. On these graphs, the x-axis is the total number of cases Read more
US Data Updates 6/11/20
These graphs show data related to the covid-19 pandemic in the US. People have been asking whether (a) states opening up, or (b) protests are resulting in more cases of covid-19. If they are, Read more
Why Data Smoothing Must be Based on 7 Day Periods
Many states do not report results daily. Many states show weekly cycles of under-reporting on certain days and over-reporting on other days. For example, my state (WA) does not report on Sundays. Consequently, I Read more
State Testing Trends – 6/10/20
These graphs show data related to the covid-19 pandemic in the US.
State Raw Data- 6/10/20
These graphs show data related to the covid-19 pandemic in the US.
Background on Infection Models
Positive test cases are the foundation for calculating the total number of infections, as well as for trending the number of infections. However, test cases account for only a fraction of total infections, due Read more
State Contagiousness – 6/10/20
These graphs show data related to the covid-19 pandemic in the US.
State Open-Readiness Assessments for 6/10/20
These assessments show state-level data that can help assess each state's readiness to reopen.
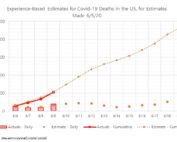
Estimation Update
I'm posting an incremental update to my estimate-tracking graph today, because I think it shows how the deaths were under reported on Sunday and Monday, but on Tuesday we're all caught up. That pattern Read more
US Data Updates 6/8/20
These graphs show data related to the covid-19 pandemic in the US. Today I'm showing the smoothed graphs first, because I think it's easier to see the trend in (a) increase in positive tests, Read more
State Open-Readiness Assessments for 6/8/20
These assessments show state-level data that can help assess each state's readiness to reopen.
State Open-Readiness Assessments for 6/7/20
These assessments show state-level data that can help assess each state's readiness to reopen.
History of Positive Tests by State (Animation)
This video shows the history of positive test results in each state. Each state's point on the graph represents the number of positive tests per 1000 residents for the 7 day period indicated at Read more
State Open-Readiness Assessments for 6/5/20
These assessments show state-level data that can help assess each state's readiness to reopen.
US Data Updates 6/5/20
These graphs show data related to the covid-19 pandemic in the US.
Estimate Review and Update 6/6/20
Estimation Review for 5/25 Estimates The estimates made on 5/25 are now complete so it's time to review how they did. This set of estimates was more accurate than the earlier estimates on a Read more
US Data Updates 6/3/20
These graphs show national-level data related to the covid-19 pandemic in the US.
State Open-Readiness Assessments for 6/3/20
These assessments show state-level data that can help assess each state's readiness to reopen.
US Data Updates 6/2/20
These graphs show data related to the covid-19 pandemic in the US.
Tech Talk: Weekly Update 6/4/20
Tech Talk: Covid-19 Data and Estimates—Week in Review. I give a weekly update on Covid-19 data, trends, and estimates. These are slides from that presentation. The presentations are normally on Friday mornings and are Read more
US Log Graph Updates 6/1/20
These log graphs provide a different perspective on the rate of Covid-19 positive tests and deaths. On most graphs, the x-axis is time. On these graphs, the x-axis is the total number of cases Read more
Tech Talk: Weekly Update 5/29/20
Tech Talk: Covid-19 Data and Estimates—Week in Review. I give a weekly update on Covid-19 data, trends, and estimates. These are slides from that presentation. The presentations are normally on Friday mornings and are Read more
Estimate Review and Update 5/25/20
Estimation Review for 5/13 Estimates The estimates made on 5/13 are now complete so it's time to review how they did. Error is calculated using "Balanced relative Error (BRE)". This set of estimates was Read more
Tech Talk: Weekly Update 5/22/20
Tech Talk: Covid-19 Data and Estimates—Week in Review. I give a weekly update on Covid-19 data, trends, and estimates. These are slides from that presentation. The presentations are normally on Friday mornings and are Read more
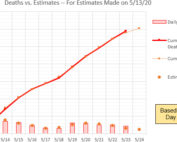
Estimate Review and Update 5/13/20
Estimation Review for 4/30 Estimates The estimates made on 4/30 are now complete so it's time to review how they did. Error is calculated using "Balanced relative Error (BRE)". Technique #1 did OK. Average Read more
Estimates for Total US Deaths – Next 12 Days
I've been following the data long enough that it's time to make some estimates. These estimates are based on the observation that there is a 12-day lag between positive test results and deaths [Note: Read more

