We have quite a few interesting things going on in recent data.
Positive Tests Up More, Deaths Still Flat
The interesting issue continues to be the significant increase in positive tests with deaths being more or less flat the past week. Daily numbers of positive tests hit several new highs this week, far higher than the previous highs we hit in the early spring. Deaths are still trending slightly down (except for the 1877 deaths that NJ dumped into the data pool on one day).
New Infections Are Basically Flat
One of my two infection models is showing an increase in infections; the other is showing a decrease. The average of the two models is basically a flat line. This is consistent with what we’re seeing in the deaths trend — which is also basically flat. (See the graph of Daily New Covid-19 Infections.)
The CDC stated earlier this week that they believe infections are about 10x the number of positive tests. For the full time of the pandemic, my estimates match that. However, for the past 1-2 weeks, my models say the gap has closed a lot. My models say the current multiplier is somewhere in the range of 1.5-4x. A big increase in positive tests today doesn’t mean the same thing that a big increase in positive tests meant in April, May, or even early June.
Average Age Being Tested is Going Down
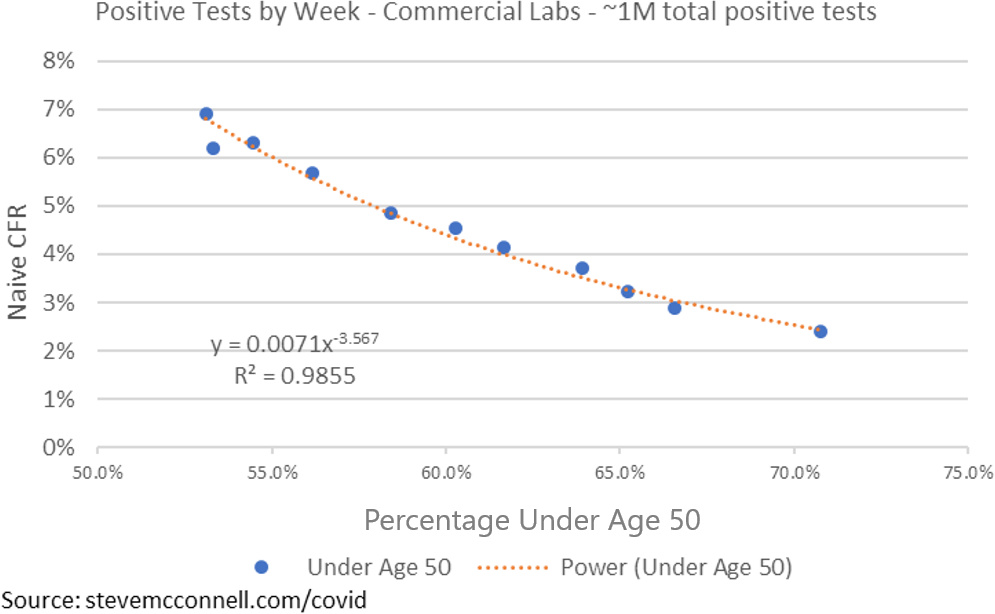
The Naive CFR has been trending down. According to CDC data, a younger portion of the population is getting infected, for whom the disease is much less deadly. That accounts for the long-term decrease in deaths — and with an extremely high RSQ value (0.9855). (See the graph of average age and also the RSQ scatter plot and trend line graph).
The Virus Stays in the South
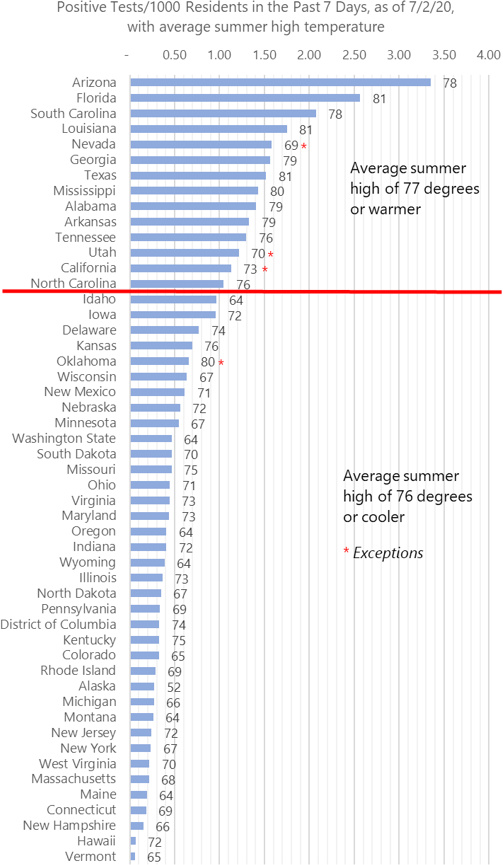
The pattern from last week of the virus being most active in the hottest states continues, as does the pattern of it being less active in the states with milder summer weather. As noted last week, the 13 states with the highest rates of new positive tests all have average summer highs of 77 degrees or warmer. The exceptions are NC, CA, and NV. NC is low by only one degre; all of CA’s major cities average higher than 77 degrees; and NV’s major population center of Las Vegas has an average high of about 100 degrees. So these are not really exceptions.
The bottom 38 states + DC average highs of 76 degrees or less, with only one exception in the south (OK) and one in the north (UT). To me, I think there’s credence to the theory that people have moved inside for the A/C in the hotter states, and that’s accelerating the spread of the virus.
New Graph This Week
I’ve added a few new graphs this week: a daily new tests graph, a daily contagiousness graph, and a state-readiness summary.


