Exploration of data related to covid-19.
US Data Updates 6/3/20
These graphs show national-level data related to the covid-19 pandemic in the US.

Exploration of data related to covid-19.
These graphs show national-level data related to the covid-19 pandemic in the US.
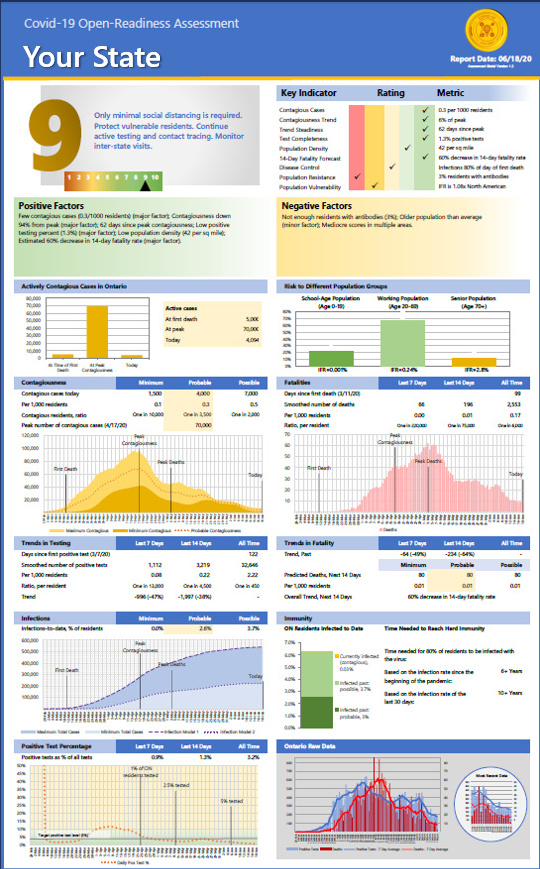
These assessments show state-level data that can help assess each state's readiness to reopen.
These graphs show data related to the covid-19 pandemic in the US.
Tech Talk: Covid-19 Data and Estimates—Week in Review. I give a weekly update on Covid-19 data, trends, and estimates. These are slides from that presentation. The presentations are normally on Friday mornings and are free. You can see the schedule and sign up here.
These log graphs provide a different perspective on the rate of Covid-19 positive tests and deaths. On most graphs, the x-axis is time. On these graphs, the x-axis is the total number of cases to date, and the y-axis is the number of cases added incrementally each week. As the pandemic winds down, the Read more
Tech Talk: Covid-19 Data and Estimates—Week in Review. I give a weekly update on Covid-19 data, trends, and estimates. These are slides from that presentation. The presentations are normally on Friday mornings and are free. You can see the schedule and sign up here.
Estimation Review for 5/13 Estimates The estimates made on 5/13 are now complete so it's time to review how they did. Error is calculated using "Balanced relative Error (BRE)". This set of estimates was more accurate than the first set. Average error on the daily estimates was 24%, median was 17%, and 67% of Read more
Tech Talk: Covid-19 Data and Estimates—Week in Review. I give a weekly update on Covid-19 data, trends, and estimates. These are slides from that presentation. The presentations are normally on Friday mornings and are free. You can see the schedule and sign up here.
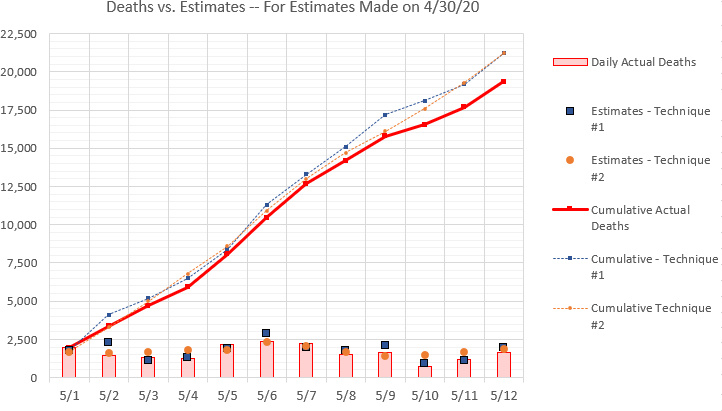
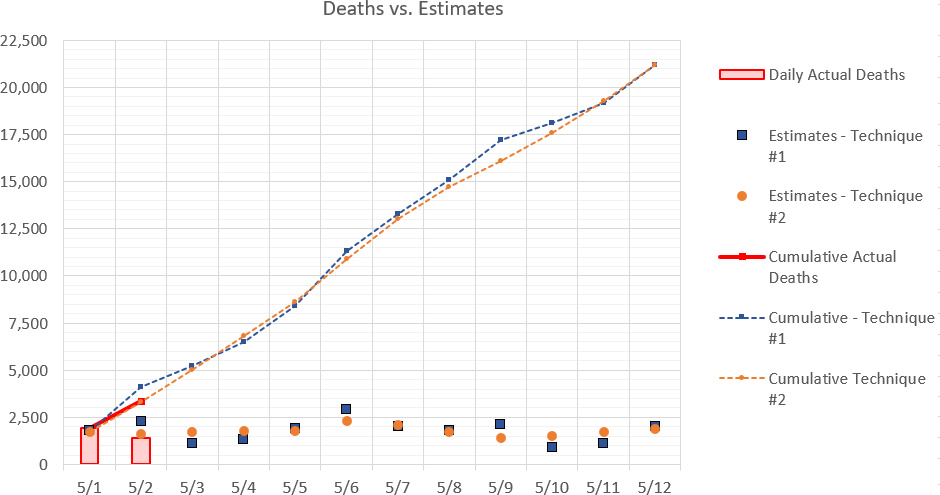
Estimation Review for 4/30 Estimates The estimates made on 4/30 are now complete so it's time to review how they did. Error is calculated using "Balanced relative Error (BRE)". Technique #1 did OK. Average error on the daily estimates was 33%, median was 19%, and 75% of the estimates were within 25% of actual Read more
I've been following the data long enough that it's time to make some estimates. These estimates are based on the observation that there is a 12-day lag between positive test results and deaths [Note: later this was updated to 13 days]. Based on the combination of positive tests 12 days earlier and an approximation Read more