Exploration of data related to covid-19.
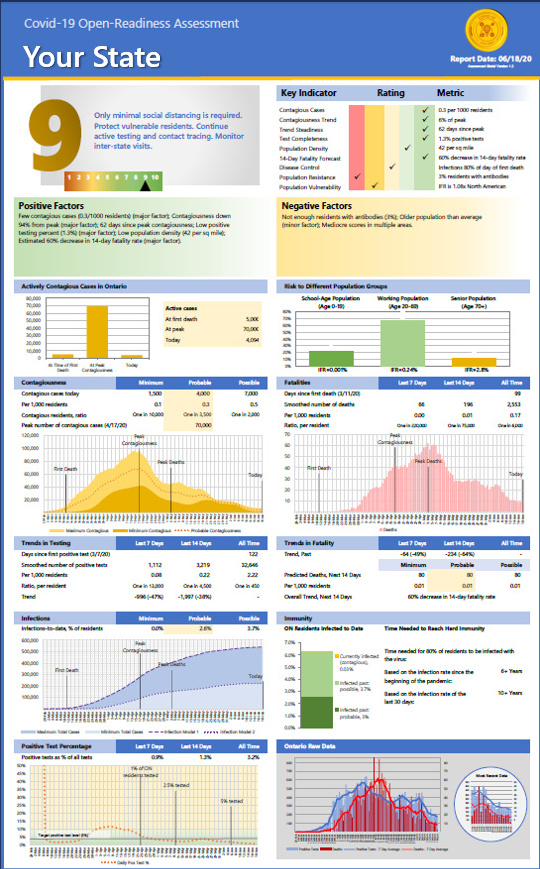
State Contagiousness – 6/10/20
These graphs show data related to the covid-19 pandemic in the US.

Exploration of data related to covid-19.
These graphs show data related to the covid-19 pandemic in the US.
These assessments show state-level data that can help assess each state's readiness to reopen.
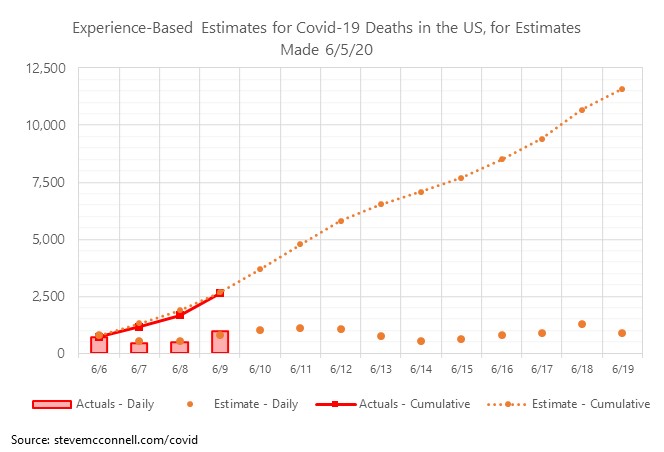
I'm posting an incremental update to my estimate-tracking graph today, because I think it shows how the deaths were under reported on Sunday and Monday, but on Tuesday we're all caught up. That pattern is typical, and my estimation model accounts for it. However, the under reporting this past weekend seemed more pronounced than Read more
These graphs show data related to the covid-19 pandemic in the US. Today I'm showing the smoothed graphs first, because I think it's easier to see the trend in (a) increase in positive tests, (b) decrease in positive test percentage, and (c) decrease in overall deaths. Read more
These assessments show state-level data that can help assess each state's readiness to reopen.
These assessments show state-level data that can help assess each state's readiness to reopen.
This video shows the history of positive test results in each state. Each state's point on the graph represents the number of positive tests per 1000 residents for the 7 day period indicated at the top. The solid bar represents where the state was 7 days prior to that. The hollow bar represents where Read more
These assessments show state-level data that can help assess each state's readiness to reopen.
These graphs show data related to the covid-19 pandemic in the US.
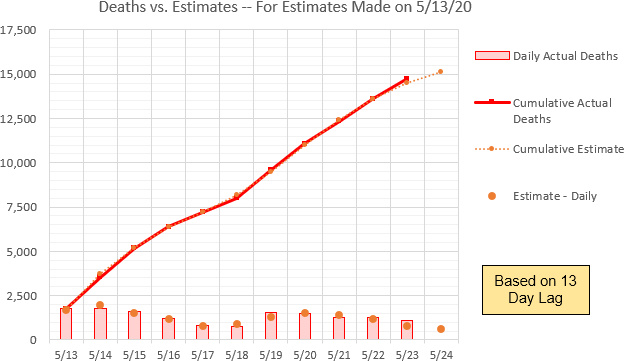
Estimation Review for 5/25 Estimates The estimates made on 5/25 are now complete so it's time to review how they did. This set of estimates was more accurate than the earlier estimates on a daily basis, but the cumulative estimates were further off. Average error on the daily estimates was 20%, median was 12%, Read more