State Data – Raw and Smoothed – 7/2/20
These graphs show data related to the covid-19 pandemic in the US.

These graphs show data related to the covid-19 pandemic in the US.
These graphs show data related to the covid-19 pandemic in the US.
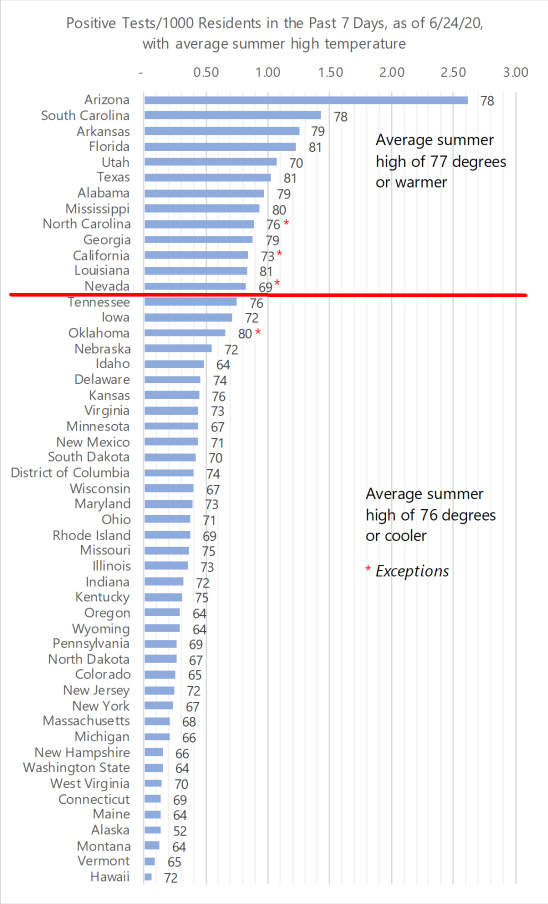
The percentage of virus tests that show positive results ("positivity") is an indicator of the percentage of the total infections that is being identified through testing. The higher the positivity is, the lower the percentage of overall infections being detected is, all other factors being held constant. Most states started with high positivity (in Read more
These log graphs provide a different perspective on the rate of Covid-19 positive tests and deaths. On most graphs, the x-axis is time. On these graphs, the x-axis is the total number of cases to date, and the y-axis is the number of cases added incrementally each week. As the pandemic winds down, the Read more
These graphs show data related to the covid-19 pandemic in the US.
We have quite a few interesting things going on in recent data.Positive Tests Up More, Deaths Still FlatThe interesting issue continues to be the significant increase in positive tests with deaths being more or less flat the past week. Daily numbers of positive tests hit several new highs this week, far higher than the previous Read more
These graphs show data related to the covid-19 pandemic in the US.
Tech Talk: Covid-19 Data and Estimates—Week in Review. I give a weekly update on Covid-19 data, trends, and estimates. These are slides from that presentation. The presentations are normally on Friday mornings and are free. You can see the schedule and sign up here. .]
We have quite a few interesting things going on in recent data. Positive Tests Up, Deaths Flat The interesting issue continues to be the significant increase in positive tests with deaths being more or less flat the past week. If you look at the smoothed test data, tests were basically flat (down then up) Read more
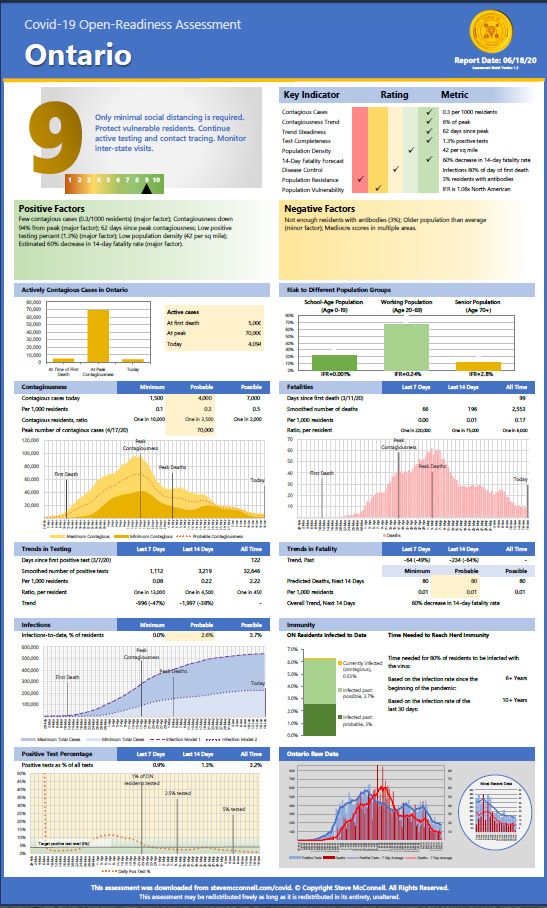
These assessments show state-level data that can help assess the state of the pandemic in each province.