Provincial Pandemic Assessments for 7/31/20
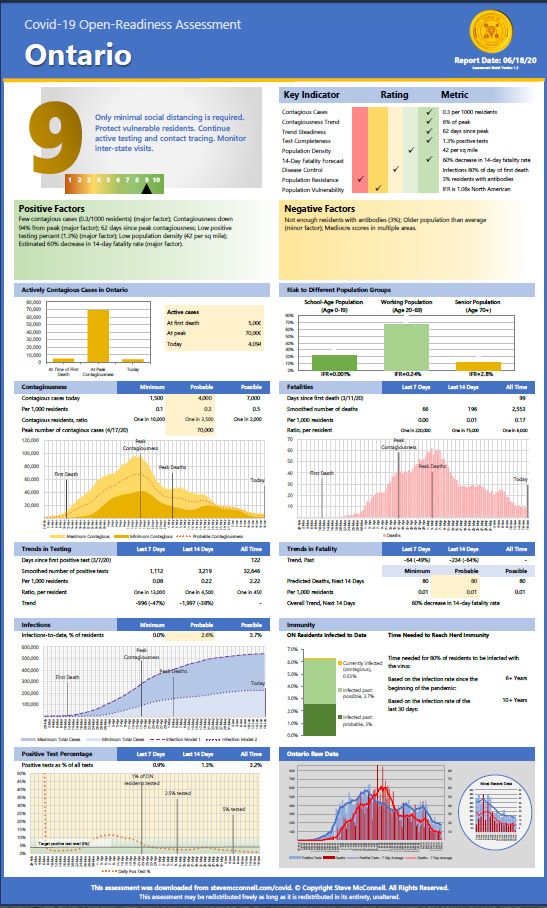
These assessments show state-level data that can help assess the state of the pandemic in each province.

These assessments show state-level data that can help assess the state of the pandemic in each province.
Test Positivity The percentage of virus tests that show positive results ("positivity") is an indicator of the percentage of the total infections that is being identified through testing. The higher the positivity is, the lower the percentage of overall infections being detected is, all other factors being held constant. Most states started with high Read more
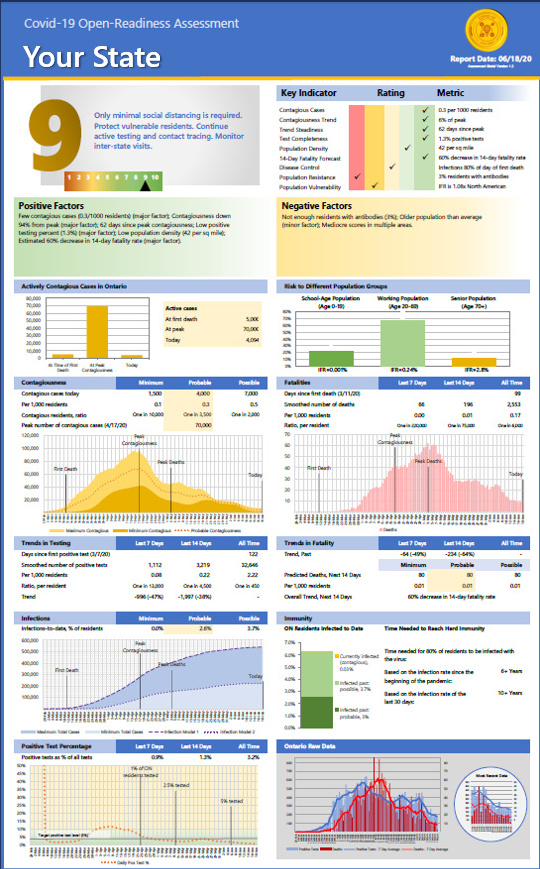
These assessments show state-level data that can help assess each state's readiness to reopen.
There's a New York Times article today that makes some comments about percentage of positive tests in each state. It's quite critical, and I think it whitewashes the challenge of building the surge capacity that's needed to respond quickly. Most states had testing pretty well under control at the end of May, but with Read more
These assessments show state-level data that can help assess each state's readiness to reopen.
These assessments show state-level data that can help assess each state's readiness to reopen.
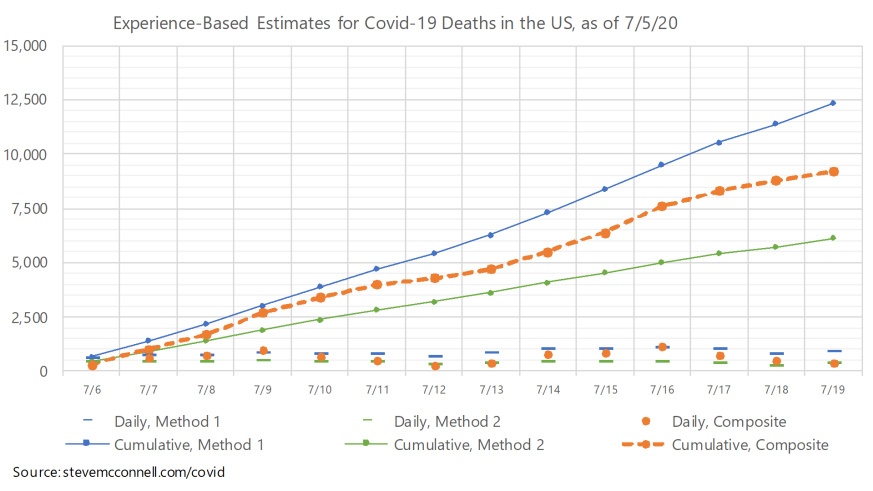
Recent Covid-19 Fatality Forecasts are Far Too Dire With the sharp increase in positive tests being reported recently, we are starting to see some really extreme predictions about the death rates over the next few weeks–including people predicting “hundreds of thousands of deaths.” Such predictions are extreme and unfounded. Read more
These graphs show the history of Covid-19 infections in each province. The total number of infections is calculated using the two infection models. Most provinces have had few enough positive tests and deaths that the numbers are too small to model accurately. The graphs are nonetheless provided for the sake of completeness. Irregularities in Read more
These graphs show data related to the covid-19 pandemic in Canada.
These graphs show the 7-day trends in positive test results for each province. The data has been retrieved from the Government of Canada. The graphs compare the number of positive tests for the most recent 7-day period to the results for the preceding 7-day period. In other words, they compare the most recent days Read more