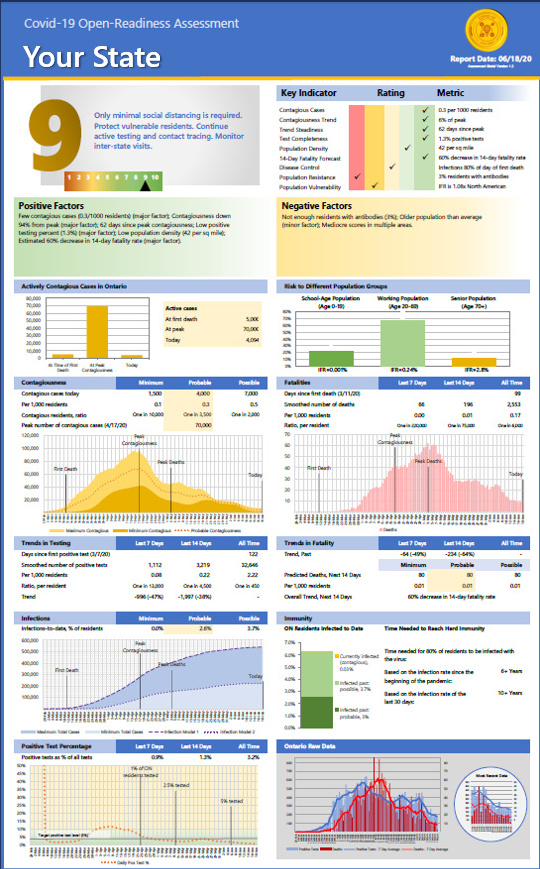
Estimate Review and Update 6/6/20

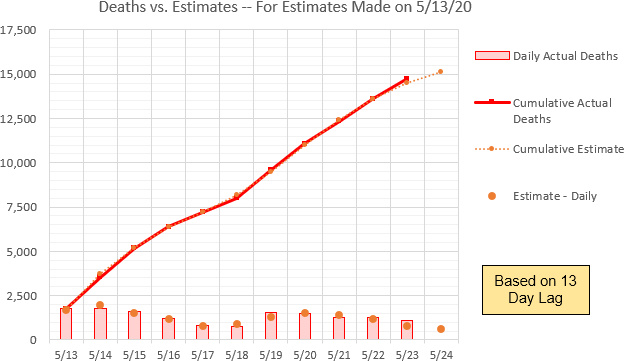
Estimation Review for 5/25 Estimates The estimates made on 5/25 are now complete so it's time to review how they did. This set of estimates was more accurate than the earlier estimates on a daily basis, but the cumulative estimates were further off. Average error on the daily estimates was 20%, median was 12%, Read more

By |2020-06-12T15:17:29+00:00June 6th, 2020|0 Comments

US Log Graph Updates 6/1/20

These log graphs provide a different perspective on the rate of Covid-19 positive tests and deaths. On most graphs, the x-axis is time. On these graphs, the x-axis is the total number of cases to date, and the y-axis is the number of cases added incrementally each week. As the pandemic winds down, the Read more

By |2020-06-12T15:18:31+00:00June 1st, 2020|0 Comments
Go to Top