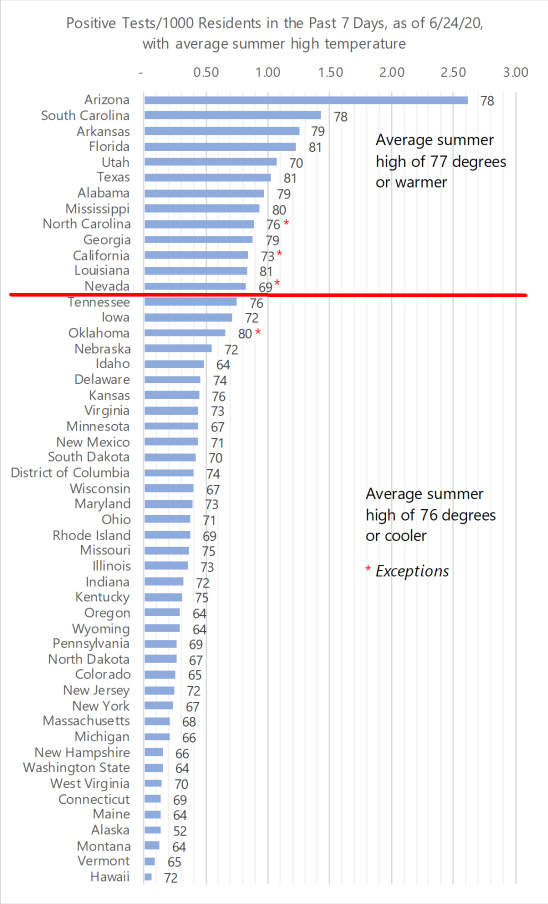
We have quite a few interesting things going on in recent data.
Positive Tests Up, Deaths Flat
The interesting issue continues to be the significant increase in positive tests with deaths being more or less flat the past week.
If you look at the smoothed test data, tests were basically flat (down then up) from about June 3 to about June 10. After June 10 they were higher than they had been on June 3. The positive test rate was effectively flat during this period too, and naive CFR was effectively flat.
Now things get interesting, because after June 10 there’s only up, no down. So we have 14 days (June 11-June 24) where the tests are going straight up AND the positive test rate is also going UP, significantly. Positive tests are WAY up today. If deaths go up over the next 7 days, then all the data makes sense as we’ve been developing our understanding of it up to this point. But if deaths go down, then we’ll need to search for some reason. One possible reason is that, on average, a younger portion of the population is getting infected, for whom the disease is much less deadly.
The Virus Moves South
We are also now seeing clearly that the virus has moved south. Here are the states that had above 0.5 positive tests per 1000 residents over the past 7 days:
Southern States: AZ, CA, NV, TX, OK, AR, LA, MS, TN, AL, GA, NC, FL, SC
Northern States: UT, IA
One theory is weather improved in the northern states and people shifted outside, the virus waned. Meanwhile, as summer temperatures began to soar in the southern states, people moved indoors for the air conditioning, and the virus took off.
If you look at the bar graph that’s sorted by number of positive tests per 1000 residents, the top 13 states all have average summer highs of 77 degrees or warmer. The exceptions are NC, CA, and NV. All of CA’s major cities average higher than 77 degrees, as does Las Vegas.
The bottom 38 states + DC average highs of 76 degrees or less, with only one exception OK. To me, I think there’s credence to this theory.

