Estimation Review for 5/25 Estimates
The estimates made on 5/25 are now complete so it’s time to review how they did.
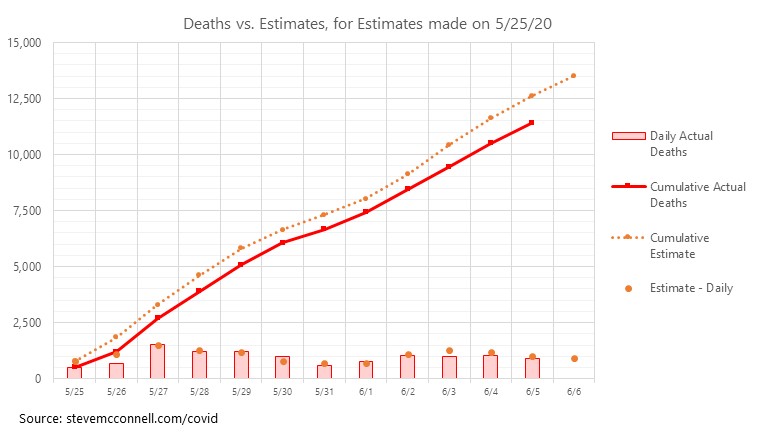
This set of estimates was more accurate than the earlier estimates on a daily basis, but the cumulative estimates were further off. Average error on the daily estimates was 20%, median was 12%, and 69% of the estimates were within 25% of actual (Pred(25)). On a cumulative basis, however, the average daily error was 19% and median was 11%. Only 31% of the estimates were within 10% of actual. I care about the error on the cumulative estimates more than on the daily estimates, so I consider these estimates to be worse than the earlier ones.
I went back and looked at whether the old approach would have worked better than the newer one, and it would not have. I think what happened with this set of estimates is that the way I’ve been approximating CFR through positive test % didn’t keep up with how rapidly the positive test % has been dropping. I’ve done quite a bit of analysis to do a better curve fit of the relationship between positive test % and the % of infections actually tested. Those will be reflected in the next set of estimates.
The graph below shows the “tale of the tape” for the last set of estimates.
New Estimates as of 6/6/20
This set of estimates uses the new approach to calculating % of infections tested from the positive test %. My estimate of total new deaths for the period 6/6 through 6/19 is 11,400.


