
 New National Baseline Forecasts
My national death forecasts for the next 4 weeks are
9/6-12 5261
9/13-19 5178 (2-week total of 10,439)
9/20-26 5220 (3-week total of 15,659)
9/27-10/3 5220 (4-week total of 20,879)
As I’ve taught in software estimation classes for many years, a person should present estimates with precision that’s commensurate with the probable accuracy of the estimates, so my forecasts should really look more like this:
9/6-12 5250
9/13-19 5250 (2-week total of 10,500)
9/20-26 5250 (3-week total of 15,750)
9/27-10/3 5250 (4-week total of 21,000)
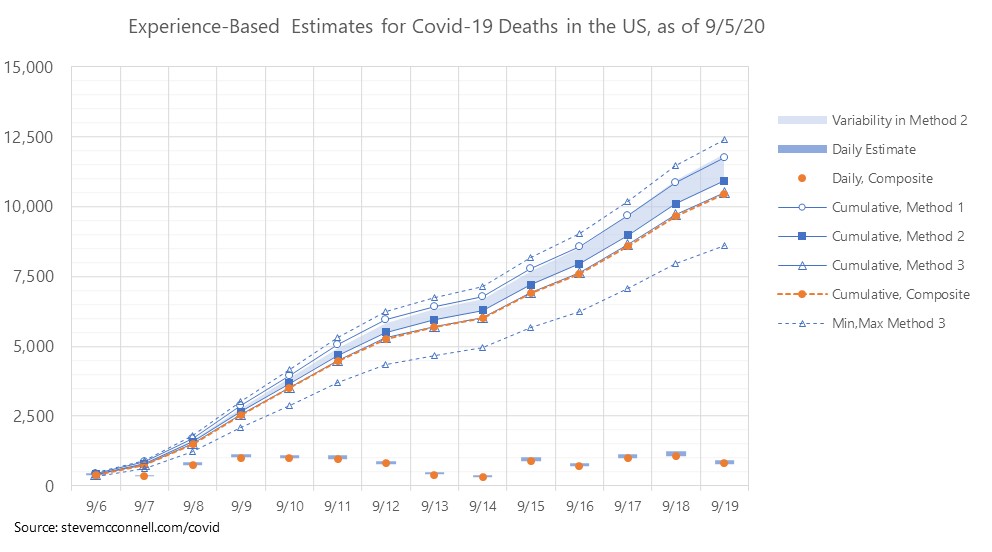
I believe there’s more uncertainty in this week’s forecasts than there has been for a while, so my prediction intervals (ranges) are wider than they were the past couple of weeks.
Two weeks out, my range goes from 8,500 to 12,500.
Review of Previous Forecasts
My forecasts submitted to the CDC the past two weeks have performed fairly well.
My national fatality forecast for last week was the most accurate of any group’s, with an error of 0.8%. For the last two weeks, I scored myself in third place, with an error of 2.6%.
For the state fatality Prediction Interval forecasts (95% ranges), my forecasts have been 1st or 2nd best the past 2 weeks.
For the state fatality Point forecasts, I’ve been in the middle of the pack so far.
Overall I feel I’m contributing value with the national forecasts and state prediction interval forecasts. I made several changes to the point forecasts that I submitted yesterday, so we’ll see what happens with those.
Background on Estimation Methodology
Estimating Deaths from Infections and the Fatality Rate
If we knew the number of infections, and we knew the infection fatality rate (IFR), it would be very simple to forecast the number of deaths from the number of infections. Throughout the pandemic, however, we have been estimating both the number of infections and the IFR, and in many cases doing that badly. The numbers also seem to vary a lot from state to state.
IFR is in the Neighborhood of 0.5%
I’ve explained how I arrived at this conclusion in an article on Medium. The super quick explanation is that this number can be calculated, at least approximately, from the antibody tests that New York State conducted in late April, combined with information about New York state’s fatalities from Covid-19. Once we know the approximate IFR, we can bootstrap methods for estimating the number of infections from the number of deaths, and that helps us zero in on the relationship between positive tests and infections.
Positive Tests Do Not Equal Infections
Positive tests and infections are not the same thing. Positive tests are a useful proxy for the number of infections, but they are not the same. This simple concept seems to thwart many of the estimates that are created.
The relationship between positive tests and infections has been shifting over time. Early in the pandemic it appeared that the ratio of infections to positive tests was somewhere between 10:1 and 20:1. Now the ratio appears to be somewhere in the range of 3:1 to 5:1.
Naive CFR
The cornerstone of my estimation approaches has been tracking the changes in Naive CFR, as an indicator of the ratio of infections to positive tests. Naive CFR is calculated as today’s deaths divided by positive tests 14 days earlier. Because deaths lag positive tests, positive tests are a useful leading indicator of future deaths.
I continue to be amazed at the huge inaccuracy of many highly publicized short-term fatality estimates. If you simply took the average naive CFR for the past 7 days and used it to estimate deaths for the next 14 days, based on 14-day-lagging positive tests, you’d create more accurate estimates for deaths over the next 14 days than the vast majority of estimates that have been published.
For my estimates through about August 1, I used the strong correlation between positive test percentage (positivity) and naive CFR. Because we know test positivity when test data is reported, it has been useful as a leading indicator of the death rate, and I’ve used recent positivity along with the number of positive tests to estimate near-term future death rates.
But Naive CFR has dropped prodigiously since the beginning of the pandemic. It started out over 50%, and for a while in early August it dropped as low as 1.4%. As Naive CFR has dropped, positivity has become less useful as a basis for estimating.
The main factor that has changed is that the average age of people being tested has been trending downward. The percentage of people who test positive that are under age 50 is also strongly correlated with naive CFR. The CDC reports that information, but not in a very timely way. It lags about 2 weeks, if it’s published at all.
Updated Estimation Methodology
Because of uncertainty in the positivity model, I’ve reverted back to using multiple estimation methods and comparing the results.
Method 1 – This is similar to the method I just described. It is a curve-fit model that is based on (a) positive test percentage (positivity) and (b) the trend in average age being tested. Both of these factors have high RSQ values vs. Naive CFR, but as the average age trends downward, part (a) of the model becomes less accurate and part (b) becomes more accurate, although neither has been super accurate for the past 5-6 weeks. I’ve also had difficulty finding recent information on ages of people being tested. The main input to this model is positive test cases from 14 days earlier than the date of estimated deaths.
Method 2 – This method is based on a trending of Naive CFR. I take the history of recent Naive CFRs, calculate a trend line, and project that forward. I then apply the estimates of future Naive CFR’s, day by day, to the positive tests from 14 days earlier. The challenge with this approach is deciding which Naive CFR trend to use. The numbers can be fairly different depending on how the trend is calculated. I start with daily smoothed Naive CFRs (based on 7-day smoothing). With that as input, I make one projection based on the one-week arithmetic average Naive CFR, one based on the two-week arithmetic average Naive CFR, and one based on the arithmetic average of the 7-day and 14-day geometric mean CFRs.
Method 3 – This is the sum of the state estimates. I’m now including confidence intervals in the state-based estimates, which accounts for the high and low.
As I work more on the state estimates I’m beginning to have more confidence in them adding up to something close to the national estimate. I’m starting to look more at whether variability from the state build up is more accurate or variability within Method 2 or from the combination of Method 1 and Method 2.
Composite Model – The composite model is the mean of Method 1, Method 3, and the minimum number from Method 2. This is then fine-tuned on a day-by-day basis to account for a history of day-of-week fluctuations in reporting.